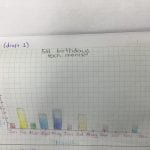
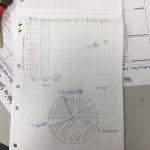
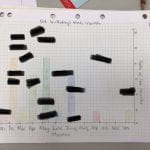
In maths, we are collecting data, and in this case we were collecting data on birthdays in our class. Some feedback I received about my first graph was that I should make the graph bigger. First I decided to try out different types of graphs to collect data. I tried a pie graph, and needed a little help with working out the percentages of my data. I got the feedback to mix the results to together and make the graph big. So I listened to the feedback and I continued to extend myself and with all the feedback I was able to finalise my last graph.